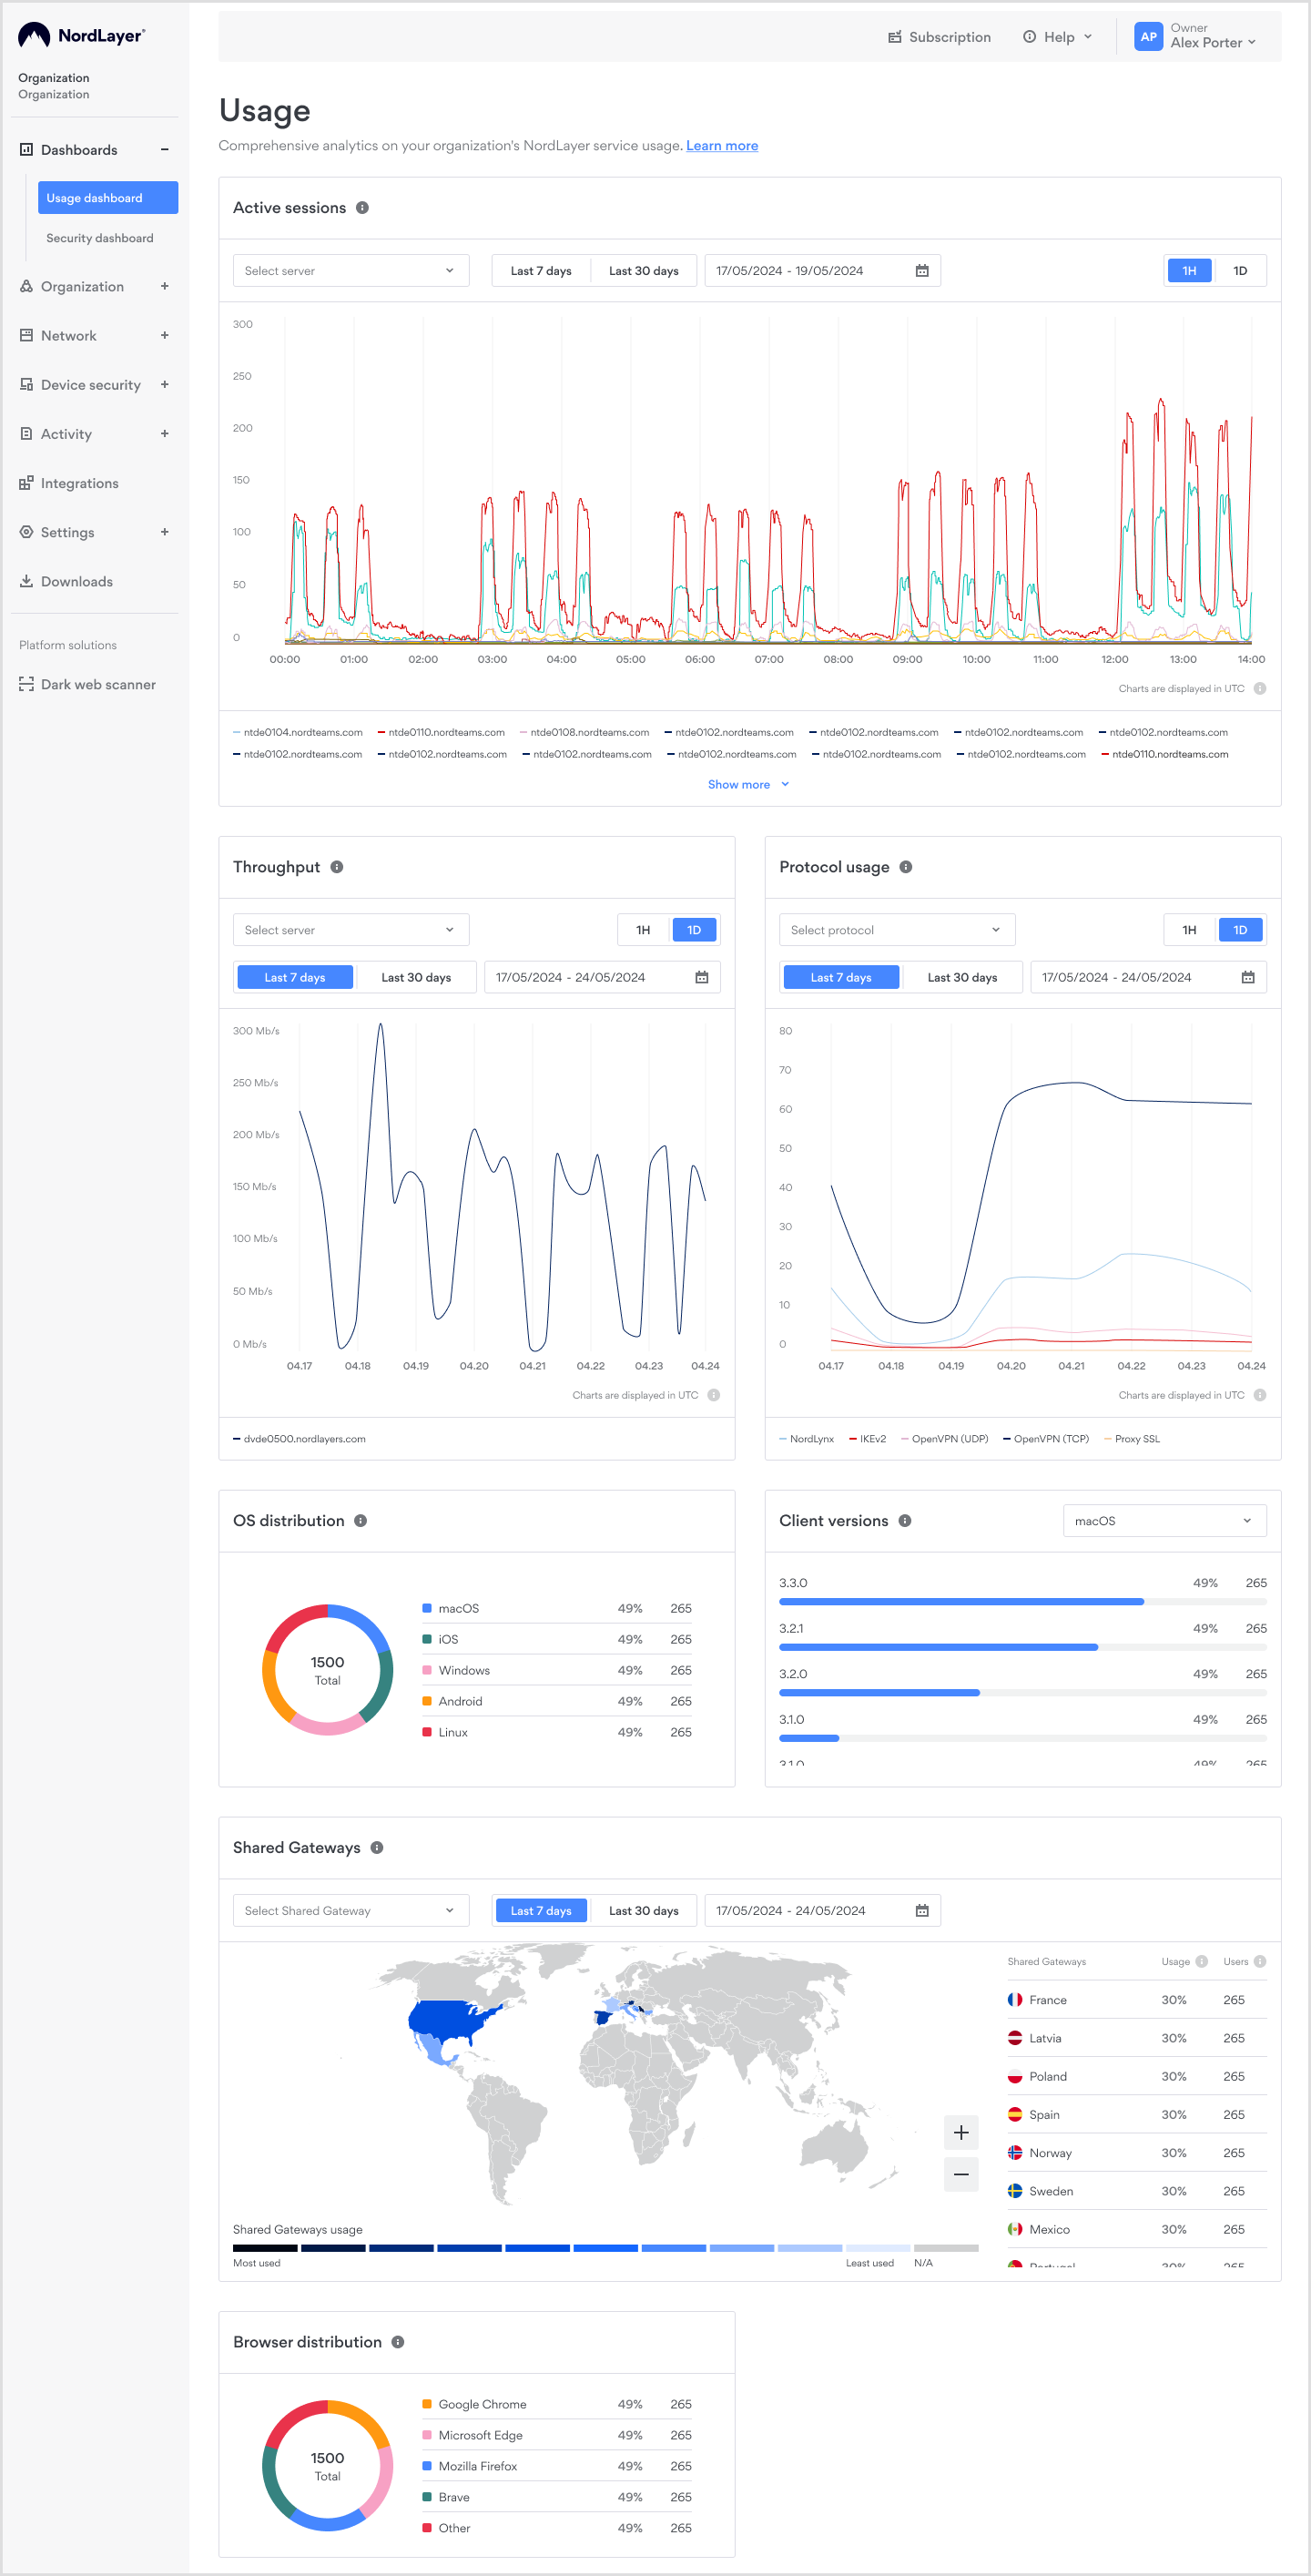
Usage dashboard offers a powerful suite of analytics tools, providing administrators with valuable insights into network activity and performance.
Widgets and their functions
Here is a breakdown of the key widgets along with their purposes:

Shared Gateways: This widget displays an interactive world map where countries are color-coded based on gateway usage within the network. On the left side, a ranked list of the top Shared Gateways is shown, sorted by the number of connections. Each connection represents a unique user accessing the gateway within a 24-hour period.
Data retention: 6 months
OS distribution: This data point gives admins visibility into the types of operating systems used across the organization. It assists in troubleshooting, planning software updates, and understanding the organization's tech landscape.
Data retention: 30 days
Client versions: This metric shows the distribution of NordLayer application versions in use within the organization. It helps identify devices running outdated versions that may lack the latest features or security patches.
Data retention: 30 days
After reinstalling or updating a device, both the previous and new versions may be reflected in the chart for up to 30 days, potentially causing the numbers to appear temporarily doubled.
Browser distribution: This data point provides insight into the various browsers used with extensions within the organization. This is useful for web development, testing, and ensuring compatibility with the organization's internal web applications.
Data retention: 30 days
Active Sessions: Shows the number of connections to different servers with a dedicated IP over a selected time range. This helps identify unusual behaviors, such as after-hours connections or connections to backup or side gateways. While the feature does not specify which particular users are connected, you can identify them by reviewing the activity log.
Data retention: 24 months
Throughput: This dashboard measures the average data transmission rate per second through the organization's private VPN gateway. By setting specific time periods for analysis, admins can efficiently monitor network throughput and assess the performance stability of their private servers.
Data retention: 24 months
Protocol Usage: Displays the connections per protocol, including Browser Extensions, over a selected time range. This aids in identifying service usage and potential compatibility issues.
Data retention: 24 months
Note: In case you have any questions or are experiencing any issues, please feel free to contact our 24/7 customer support team.